Member-only story
Working with Microservices-18: Setting Up An Alarm By Using the Grafana Dashboard and Prometheus ConfigMap.yml
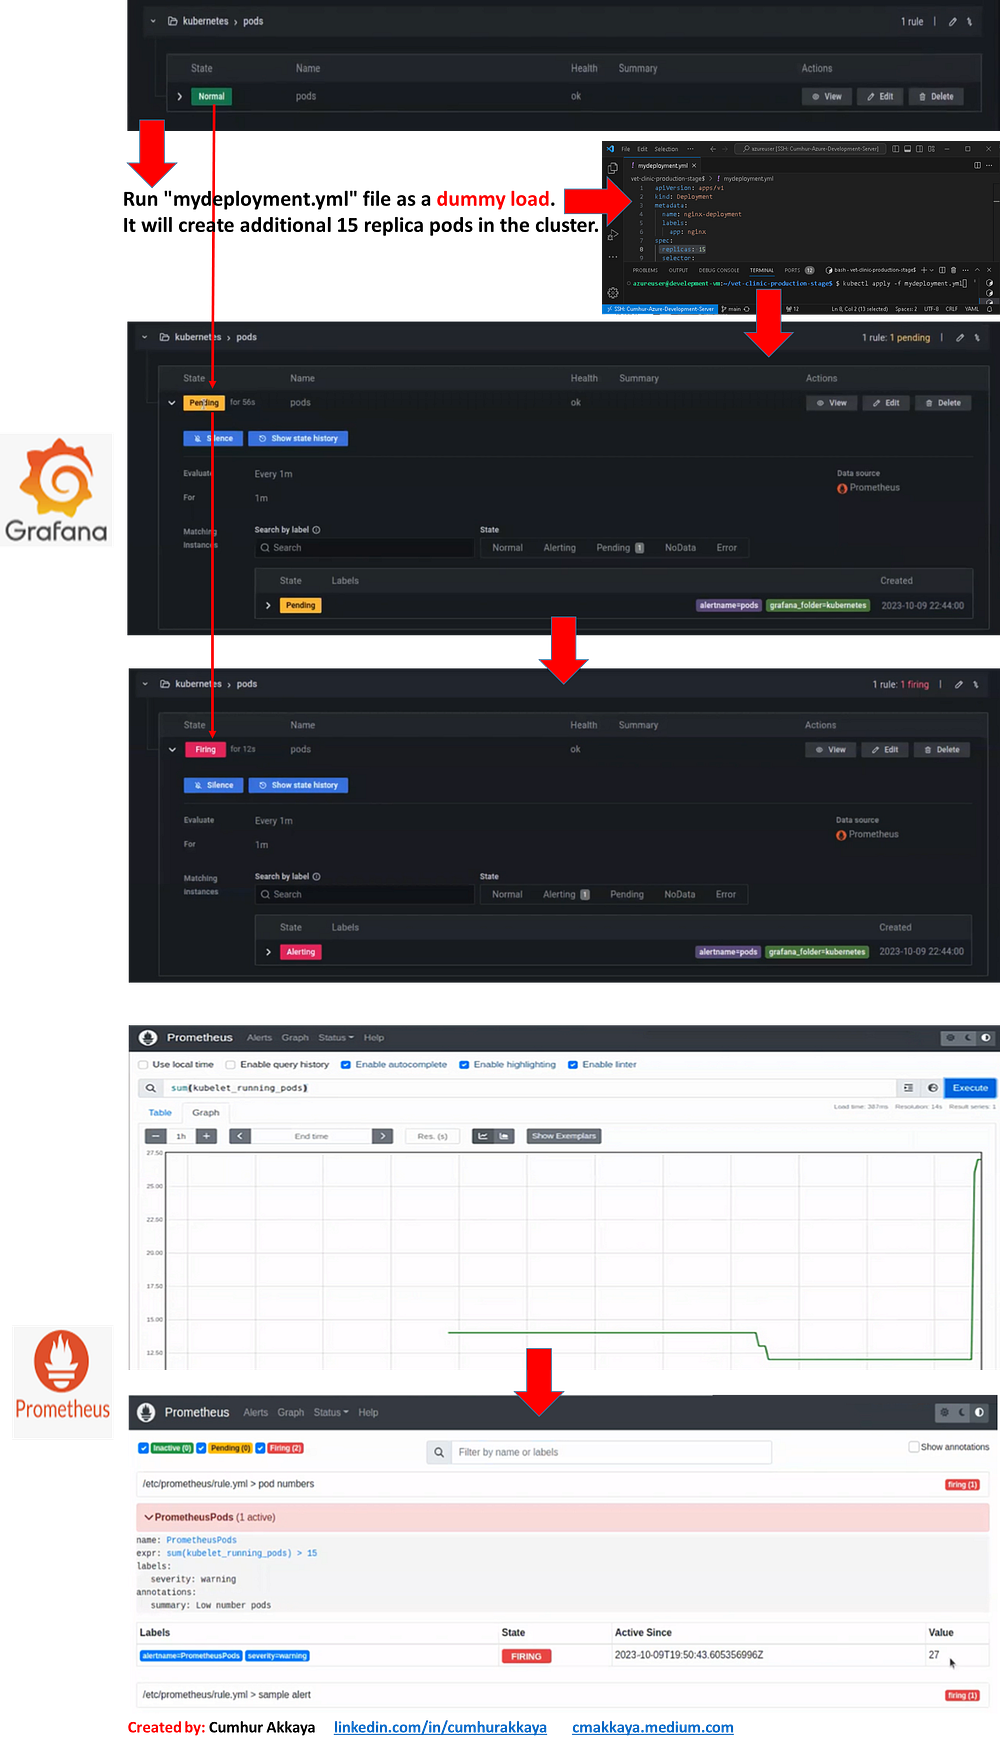
We will run Prometheus and Grafana together, collect metrics of the Kubernetes cluster with them, and then set up alarms using these metrics. We will set up the alarms (alarm rules) by using both the “Grafana” and “Prometheus ConfigMap.yml” to monitor the Kubernetes cluster. We will view and examine the alarms on the dashboards of Prometheus and Grafana. Also, we will install Prometheus and Grafana by using Helm Chart. We will do them practically and step by step.

Topics we will cover:
Previous article:
1. Changing The Ports and Services of Prometheus and Grafana
2. Configuring the Security Group of Cluster Nodes
3. Running Prometheus
4. Running Grafana and Connecting to Prometheus
5. As a result
6. Previous article: “Working with Microservices-17: Monitoring and Creating an Alarm with Prometheus and Grafana in the Production Stage”
7. References
This article:
1. Setting Up An Alarm By Using the Grafana and Examining it on the Grafana Dashboard
2. Setting Up An Alarm By Using “ConfigMap.yml” File and Examining it on the Prometheus Dashboard
3. Installing Prometheus and Grafana by Using Helm Chart
4. As a result
5. Next post: “Working with Microservices-19: Explanation of the Testing Stage, and Running a Unit Test and Configuring Code Coverage Report using Jacoco tool.”
6. References
If you like the article, I will be happy if you click the Medium Follow button to encourage me to write more, and not miss future articles.
Your clapping, following, or subscribing helps my articles to reach a broader audience…
